Machine Learning with Voronoi Modeling
Welcome, it's great to have you here. Want to hear more about the machine learning with Voronoi diagram?

A Voronoi diagram is a group of geometric regions that express classifying points in such a way that any point within the region is the nearest to the classifier than any other neighbor classifiers based on their spatial distance from one another.
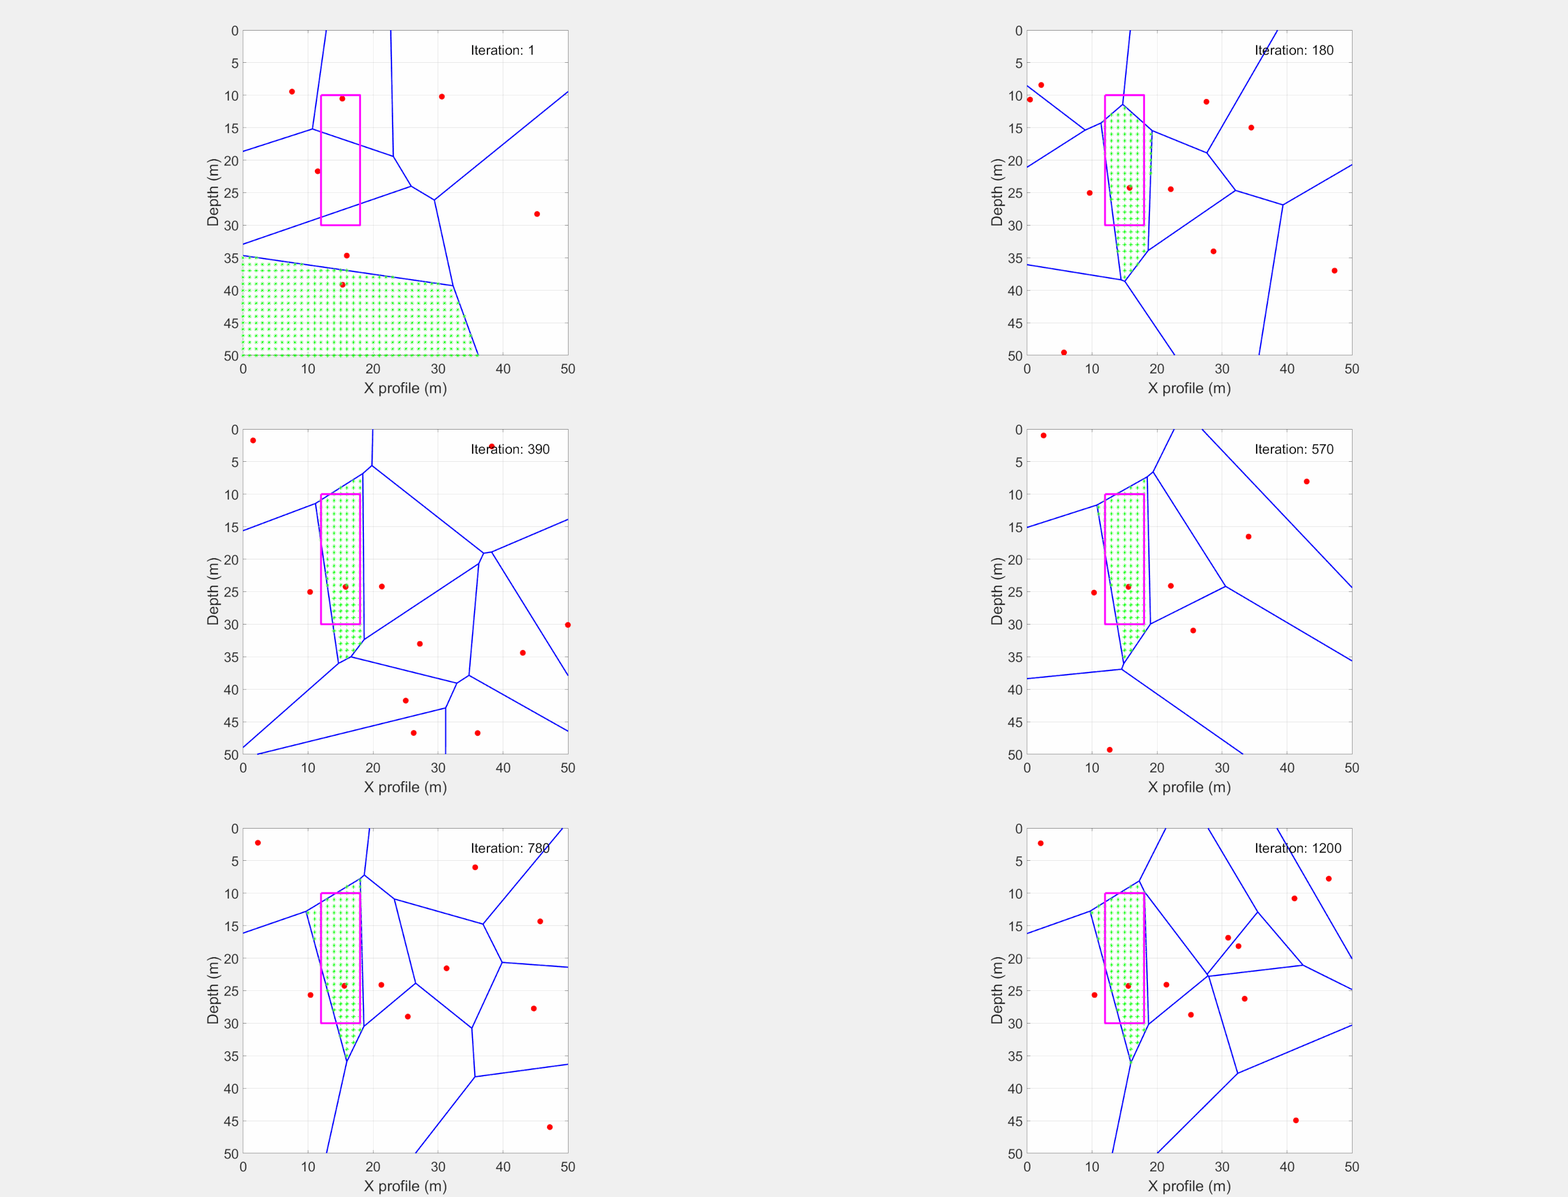
Let's assume that the true model is a square. Voronoi nodes can update their locations and also their numbers to fit available data. Please watch how the Voronoi diagram can model square geometry.
This scheme is called trans-dimensional sampling in which the number of parameters is also unknown and is inferred from data information. This modeling can be used in many applications including anomaly detection.